Visualising EPC Data
In this article I explain how I used the open data community EPC data to do some data analysis creating a visual dashboard using a range of tools like spreads sheets, google maps and Power BI.
My work in activeplan requires a lot of research and development looking into the future and how we can offer our clients better use of their data and insights.
Before I get into the details I’ll set the driver for this work which I did last year and have been building on.
Introduction
Climate change is an existential threat to life on earth, and scientists are scared because the industrial societies are still accelerating CO2 emissions in to the atmosphere. At the time of writing the current global average CO2 is 419.3 parts per million, the safe limit is 350 and trend is accelerating. When the media, press and politicians talk about can we afford green policies the data and science is very clear we can’t afford NOT to pursue green policies. In order to make the right decisions we need to know where we are starting from and this is by measuring. What is the specification of the environment and how is it performing.
There are 3 areas commonly sighted in carbon reduction towards net zero.
- Energy
- Transport
- Food
The built environment uses a lot of energy to create products, transport and construct into buildings. The buildings then have large operational energy requirements. European governments use a form of Energy assessment to grade domestic and commercial buildings. They then use this data to develop and implement policies.
Lets ask ChatGPT some questions about EPC’s
What is an EPC?
An EPC stands for Energy Performance Certificate. It is a document that sets out the assessed energy efficiency and potential CO2 emissions for a property. The property is rated on a scale from A to G with A being excellent and G a disaster. An EPC provides an energy efficiency rating (related to running costs) for a building based on the performance potential of the building itself (the fabric) and its services (such as heating, insulation ventilation and fuels used).
When did EPCs come into force and why?
Energy Performance Certificates (EPCs) were first introduced by the UK government on 1st August 2007 in England and Wales. They were introduced due to the requirements of the EU Directive on the energy performance of buildings and were to be part of the Home Information Pack (HIP), which was supplied by people who were selling properties with four bedrooms or more.
Why was HIP abandoned?
The Home Information Pack (HIP) was introduced in 2007 as part of the government’s plan to speed up the home-buying process. The pack included an Energy Performance Certificate (EPC), which was designed to give buyers an idea of how energy-efficient a property was. However, the scheme was scrapped in 2010 by the coalition government
How accurate is the EPC data?
EPC ratings are very accurate, as long as the assessor records everything correctly. However, up to 2.5 million Energy Performance Certificates (EPCs) are likely to be inaccurate due to outdated techniques to measure floor space. One in four EPCs record the size of a property so inaccurately that it varies by more than 10% from the true size of the property1. The UK government has taken steps to improve the accuracy of EPCs by introducing a new Energy Performance of Buildings Register (‘the Register’) designed according to government standards and extensively tested with Register users; the implementation of EPC lodgement rules that help prevent lodgement errors; and the publication of a consultation on options for the introduction of a new performance-based operational ratings scheme for non-domestic buildings.
Who uses the EPC data?
EPC data is used by homeowners, landlords, tenants, estate agents and solicitors. It is also used by the government to monitor energy efficiency levels across the country.
How can you visualise the EPC data for an area?
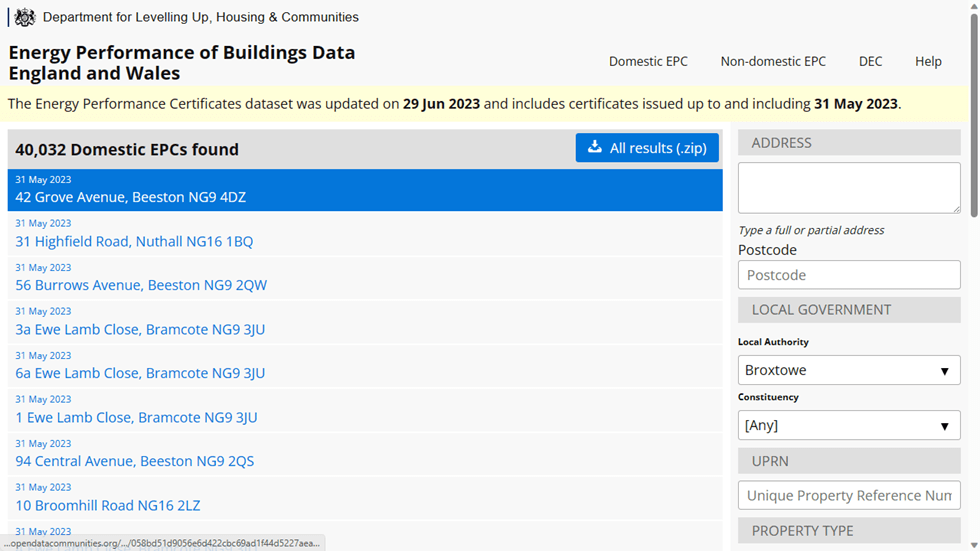
You can find EPC data for an area by visiting the Energy Performance of Buildings Data England and Wales website⁴. The website provides access to Energy Performance Certificates and Display Energy Certificates data for buildings in England and Wales. The data is searchable, browsable and downloadable individually or in bulk. You can register for access to the data on the website.
Getting Started understanding the data.
I got started on the use of EPC data when I set up an WhatsApp Energy Group for our estate in October 2021. Invites where sent on through the Estate WhatsApp Group setup by a neighbour during Covid March 2020. There are 64 Houses and 57 members of the Estate Group of which 9 are members of the Energy Group. When we started there where 3 houses with Solar panels, all of which where installed with the generous FIT (Feed in Tariff) Since starting 3 of the group have installed new solar and one extending their existing installation. There are 2 house holds with Electric Cars but 3 houses with EV charging points.
The 1st thing I did was get the EPC data for each house on the Estate and added them to a spread sheet which I have endeavoured to keep UpToDate. When we started I did not have an EPC but got one done after installing Solar and a smart hot water tank.

I then marked up a my maps plan. I then polylined each house and added the link to the find my EPC record and any planning data in the Broxtowe Planning portal.

The bigger picture.
Earlier I mentioned the media, press and politicians and how they may talk up how well we are doing, but it feels like they are using 2nd hand analysis and cherry picking data to construct a narrative that is obfuscating reality. No one, especially politicians, want to say this is bad, its very bad. Look at the initial response to Covid and promised Nirvana Brexit would bring. We need to see exactly where we are starting from and look to those who are doing it better to learn the lessons.
I live in the borough of Broxtowe which consists of some 20 wards. Broxtowe is in Nottinghamshire one of 8 constituencies and is bottom of the performance table when it comes to EPC grades. (source ons.gov.uk)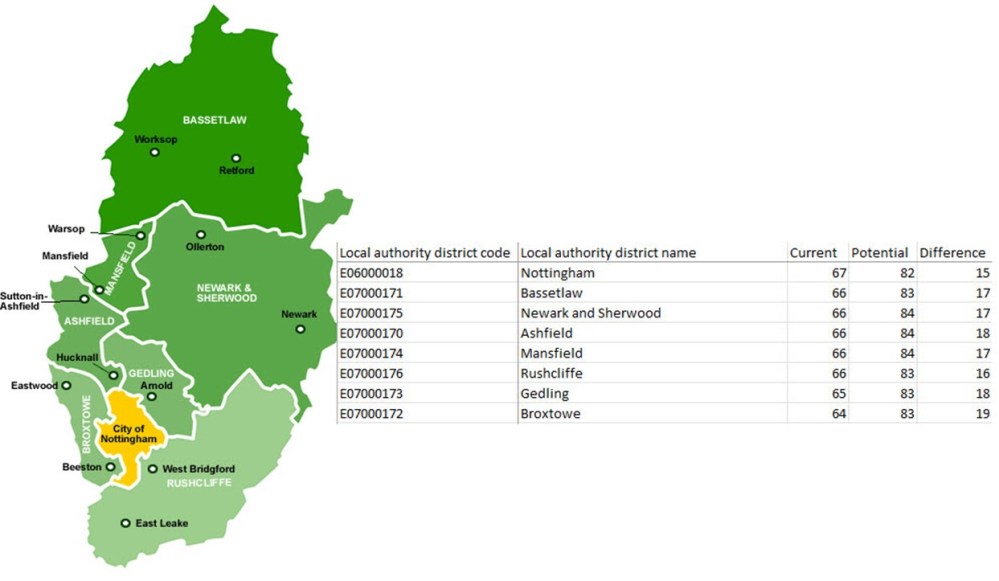
In addition to the find my EPC the UK government provides more detailed data through the open data communities initiative. This does require registration but large datasets can be downloaded for analysis. I now use this a lot for our clients to get better understanding of the facilities they manage.
The database currently has nearly 25 million records which can be filtered down using a series of methods. The down load is a csv file and I learnt there are 2 things you have to consider.
1: All the EPC lodgements are in the dataset to you need to filter the data set to the latest.
2: Demolished properties exist in the dataset and this is not easy without local knowledge to filter.
My process is to load the csv data into an excel spreadsheet using GetData this way I avoid excel miss interpreting column datatypes.
Then to remove old EPC data I process the data set using the property UPRN and lodgment date in a C# program and spit out a new spreadsheet of just the latest data.
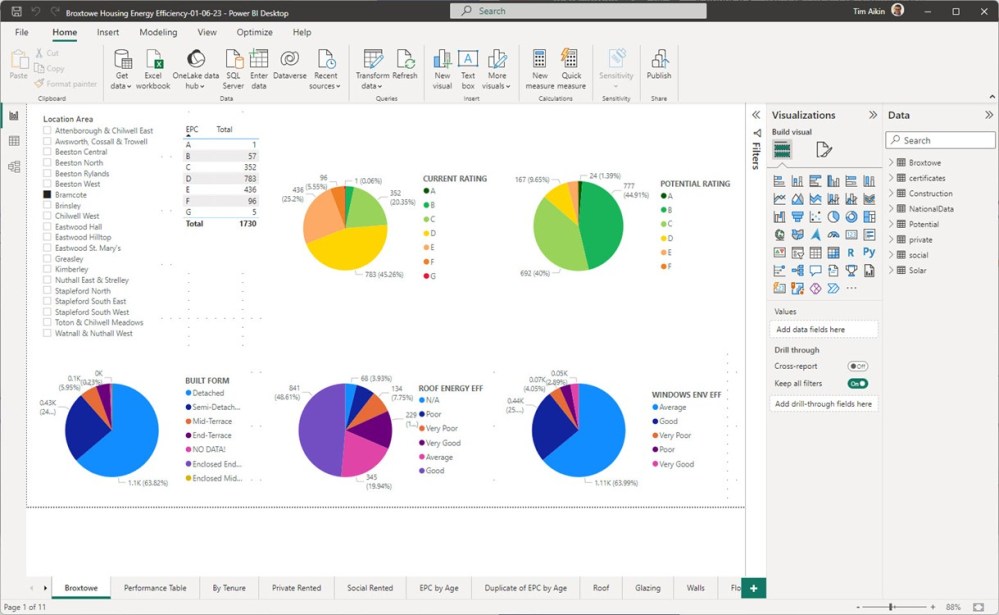
Using the Desktop version of Microsoft Power BI I load the data in and develop some queries and then develop a series of screen dashboards.
Missing from the dataset is the geo loacation of each property.
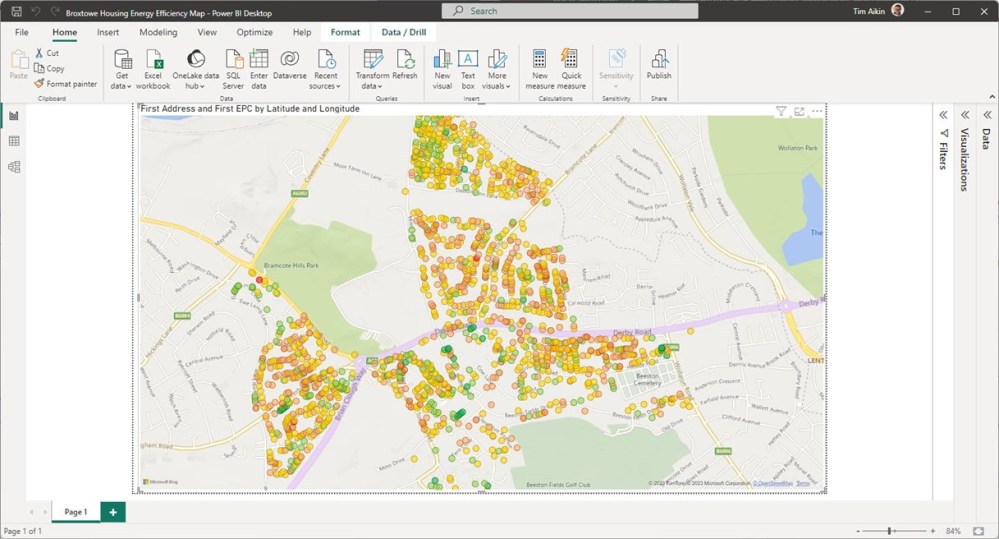
Fortunatley there is an api library provided by google called GoogleGeocodingApi which you have to get an api key for. This is an asyncronous api and I wrote a routine to send the address of each property and return a latitude and longitude value. As it takes a long time to process I only did it for the ward I live in which is relevant to the local Bramcote Neighbourhood Forum.
Once the data is loaded each of the EPC grades needs to be set to their ECP grade colour.
Sharing the data is a little more challenging as Power BI publishing no longer allows public access even if you have a licence.
The accuracy of the address location can sometimes throw out some incorrect locations but generally the results are good.
The alternative is to load the same data into google my-maps

The only issue here is that the pins do not scale.
EPC have recently had a lot of criticism about the accuracy of the energy modelling. When the modelling is compared with real world data it can be out by many Kw/m2 which is how the properties are rated.
SAP and RdSAP are not perfect and don’t use detailed information about the quality of construction, orientation, and shading. The Passive House standard is a far more accurate energy modeller but it requires more detailed information which does result in a more accurate performance to real world. However the EPC data covers over 20 million Homes in England and Wales and the dataset records factual fields, you may not agree with the modelling but the data provides some good insights into the levels of insulation, heating systems and micro generation.
Scotland has it’s own EPC register.
