Net Zero expensive? or is it costs that would have been spent anyway?

In the UK, as in other Western countries, Net Zero has turned into a contentious issue because of the substantial costs projected over a 20–30-year span. Critics tend to portray Net Zero solely as extra expenditures, neglecting to acknowledge the inevitable costs that would arise during that period regardless.
Transportation is frequently cited as an example of these “additional” costs, with critics claiming that people are being “forced” to buy battery electric cars (BEVs). In the UK, there are approximately 40.4 million vehicles, of which 35 million are cars, with an annual churn rate of about 4%. If fossil fuel cars were banned tomorrow, it would take at least 25 years to achieve 100% BEVs. However, this would only be possible if fossil fuels became unaffordable.
Transitions generally occur for financial reasons. For example, the shift from horse and cart to automobiles took about 11 years at the start of the 20th century. This change made cities healthier and allowed workers to move from overcrowded urban areas to more desirable locations. Urban water quality improved as it became less contaminated by horse urine, manure, and carcasses. While city air pollution did increase, many cities introduced electric trams and buses using overhead lines.
Post-World War II, the rise of cars and urban sprawl led to a decline in trams. However, in recent times, trams have been reintroduced to enhance public transport and reduce environmental impact. Trams have also been used as tools for urban regeneration.
The cost of replacing all the cars currently on the road can be calculated using an average cost of a new car. The average cost of a new car in the UK in 2024 is approximately £27,502 (NimbleFins) (Parkers) (Marsh Finance – Car Finance Solutions).
34,000,000 * £27,502 = £935,068,000,000 (£935.068 billion)
This is the lower end of the money that will be spent over the next 25 years on new cars regardless of NET ZERO.
The average number of miles driven by UK car drivers in 2024 is approximately 7,400 miles per year. This figure reflects a general trend of decreasing annual mileage over the past two decades, influenced by various factors such as the increase in remote working, the availability of public transport, and changes in driving habits post-pandemic.
ICE = Internal Combustion Engine BEV = Battery Electric Vehicle mpa = Miles per annum pa = per annum
The costs of new BEVs and ICE vehicles are now becoming comparable. We can calculate the savings in energy costs through the transition using the following.
Over 25 years 7400 mpa 34,000,000 cars starting at 96% ICE declining @ 4% pa = 408,000,000 miles
Over 25 years 7400 mpa 34,000,000 cars starting at 4% ICE increasing @ 4% pa = 442,000,000 miles
The average cost per mile for fossil fuel vehicles in the UK varies based on the type of fuel used. As of 2024:
1. Petrol Cars: The cost is approximately 14-16 pence per mile. This calculation is based on the average fuel price of around £1.45 per litre and an average fuel efficiency of 36 miles per gallon.
2. Diesel Cars: The cost is about 13-15 pence per mile. This is derived from the average diesel price of around £1.54 per litre and an average fuel efficiency of 43 miles per gallon.
At current prices we will use 15p per mile.
ICE fuel costs over 25 years 408,000,000 miles * 0.15p = £452,880,000,000
These costs include variations due to different car efficiencies and driving habits. It’s important to note that while diesel cars generally have better fuel efficiency, they also tend to incur higher fuel costs per litre, which can balance out the overall cost per mile compared to petrol vehicles.
The average cost per mile for battery electric cars (BEVs) in the UK in 2024 is generally between 8p and 11.5p. This range depends on the type of electric car and the method of charging used:
– Home Charging: Charging at home, especially using an off-peak electricity tariff, can significantly reduce costs. For instance, charging during off-peak hours can bring the cost down to around 2.5p to 8p per mile.
– Public Charging: Using public charging networks is more expensive. The cost per mile when using public slow/fast chargers averages around 17p per mile, while rapid/ultra-rapid chargers can cost about 24p per mile.
These figures take into account the rising costs of electricity and the varying efficiency of different electric vehicles. Despite these costs, electric cars often remain cheaper to run compared to their petrol or diesel counterparts due to lower fuel costs and fewer maintenance requirements.
For more detailed information, you can refer to sources like [ZapMap](https://www.zap-map.com), [BookMyGarage](https://bookmygarage.com), and [GOV.UK](https://www.gov.uk).
BEV energy costs over 25 years are 442000000 miles * 0.08p = £261,664,000,000
Savings between Fossil fuel and Electric over 25 years assuming prices don’t change, and the transition is a steady 4% pa starting at 96% ICE and 4% BEV.
£452,880,000,000 – £261,664,000,000 = £191,216,000,000
The transition from fossil fuels to electricity is projected to save £191.216 billion over a 25-year period. Over the past 20 years, the UK’s dependency on fossil fuels has decreased from 90% to 70%, reflecting a steady decline of 1% per year. Transitions typically do not follow a straight-line graph but rather the Tony Seba S-curve.
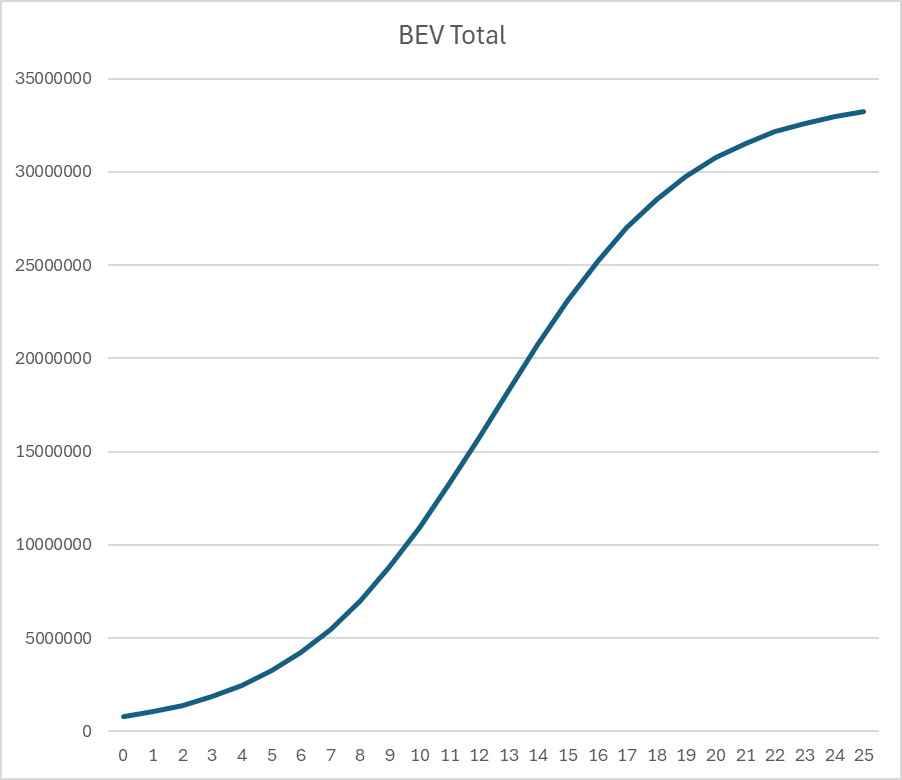
S-curve parameters
- Steepness Factor (k): A typical value for k in a technology adoption context might range from 0.1 to 0.5. A value of 0.2 to 0.3 is often used for moderate to fast adoption rates.
- Midpoint (t0): The midpoint represents the year when the transition is halfway completed. For a 25-year transition period, a reasonable estimate for t0 is around half of the period, which would be around 12.5 years.
The tipping point for a more rapid decline in fossil fuel extraction and processing is anticipated in about 10 to 20 years. Upgrading the UK’s electricity grid is an ongoing expense, as is replacing power stations every 25 to 30 years. These lifecycle costs are seldom mentioned in political discourse.
Conclusion
In conclusion, as initially stated, transitions generally occur for financial reasons. The £191.216 billion in savings can hardly be portrayed as a cost.
I have owned Battery Electric cars since 2015 and I have seen how the technology has evolved and we have benefited by employing a cost of ownership strategy to get to where we are now. My Son and Daughter both have 2nd hand EV’s and are financing them through the fuel savings. My Daughter when making her choice wouldn’t consider ICE cars. Their peer groups who all have 2nd hand ICE cars have both high fuel and maintenance costs.
